

Vishak N Kumar


Vishak N Kumar
Blogs

Sania Mirza Vs Hugh Jackman – Who give more ROI to an Indian brand?
We are always searching for something, if you know what someone is searching for then you understand him better. If you can know what a nation is searching for then you can make a killing out of it. I help companies make that killing and I make living out of it. Its called search trend analysis and is a combination of statistics, search marketing, and common sense.
This journey has helped me understand the world around me better. recently I was going through online search data related to mobile phone brands for a client of mine. I was specifically looking at the Indian Chinese brands, the ones like Karbon, Micromax, and Celkon. Have you heard about Celkon?
Celkon used Sania Mirza to launch a model called ‘Millennium Vogue Q455′ in July 2014. Having played a little bit of tennis myself, I am a big fan of hers.

Photo credits (Hindu.com)
I wanted to know how getting her involved helped the brand and this is what I found out.
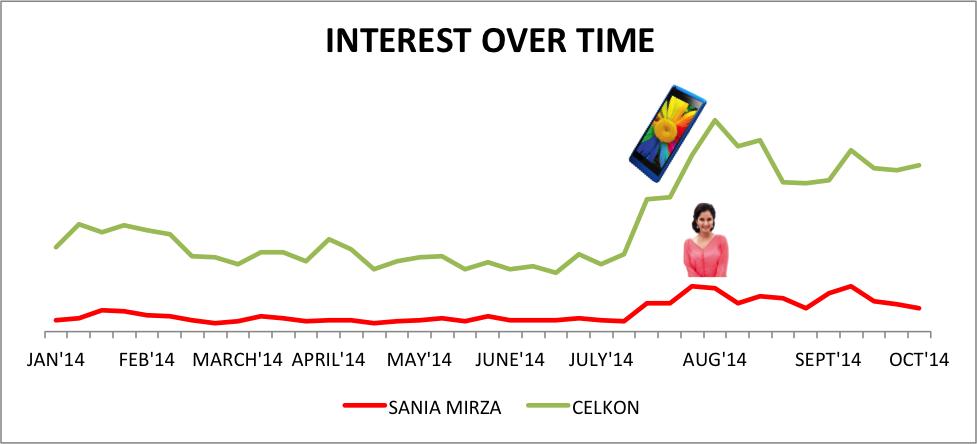
The search for Celkon started growing around the time of the launch and after a while, it’s becoming stable. So Sania Mirza launch worked for Celkon.
But the more interesting insight is the other graph, the search for Sania Mirza also started growing, but its growth declined after a while unlike the search for Celkon. To understand the reason I looked at the keywords that people were inputting.
Many of them were like “phone Sania Mirza launched”.
This means that the brand Celkon is not popular enough to have a standing of its own. People knew that Sania Mirza launched a phone, but they can’t remember which company it was and they were trying to find out.
Now, this just made me recall one of the Hugh Jackman ads from Micromax, I heard that they spend a fortune on him, so they must have got a huge spike in the search. So I collected the data and plotted the graph.
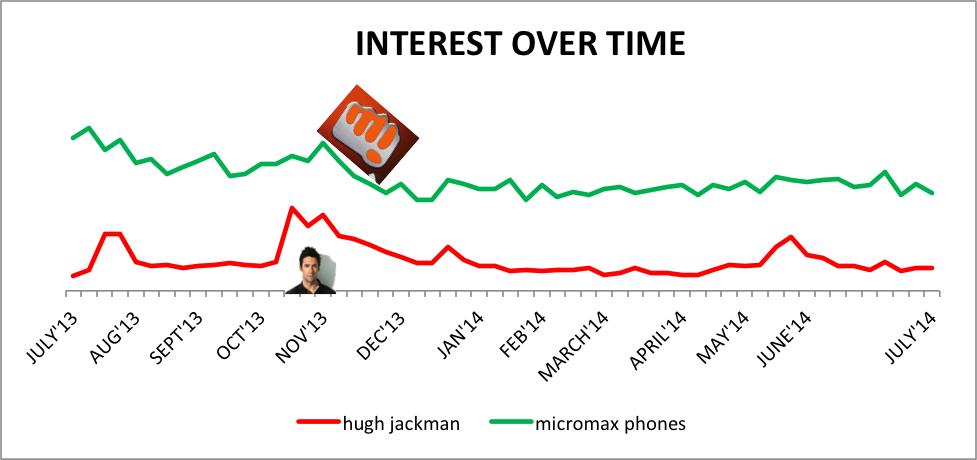
To my surprise, Hugh Jackman did not result in any considerable increase in search volume for Micromax. I thought a lot about it and finally concluded that Hugh Jackman is less popular in India than Sania Mirza. Here local celebrities work better than international celebrities. Looks like Micromax wasted money on Hugh Jackman.
Promotion:- If you want any such analysis done for your company let me know, I head a team of data scientists and programmers and help companies make sense of the data jungle out there. Please feel free to drop me an email at sanil@ayruz.com.

How to Get Cheaper Flight Tickets Online – A Digital Marketing Insight
Being a marketer for the past eight years, I try to learn new things and apply new strategies for my clients. I never thought I would exploit a marketing tactic intelligently to get more rewards while booking an air ticket online for my wife who is coming to India to attend my brother’s wedding in July 2016.
This article is about how I saved considerably for an air ticket booking, exploiting a simple tactic used by the marketing team and a critical reflection of it.
As mid of June is a busy season, getting a cheaper air ticket would be a daunting task. I tried air tickets from Yatra.com, Skyscanner, Expedia and few travel agents as well. Interestingly, the price given by the travel agent was INR 10,000 less than the price I have got from Yatra, Expedia and other travel websites.
I tried to book the ticket from the Yatra and abandoned the transaction during the booking stage. So, the Yatra customer care gave me an offer for INR 1,000 less than what the travel agent quoted me. So effectively, INR 11,000 have been saved from this negotiation. This didn’t stop me from doing further research online.
Finally, I thought I should try searching prices directly from the Etihad website. To my surprise, it is very close to what Yatra offered me. There comes the marketers mind. I tried to book from Etihad website but again abandoned the transaction at checkout page. I did this on purpose as I saw the Facebook remarketing pixel was loaded.
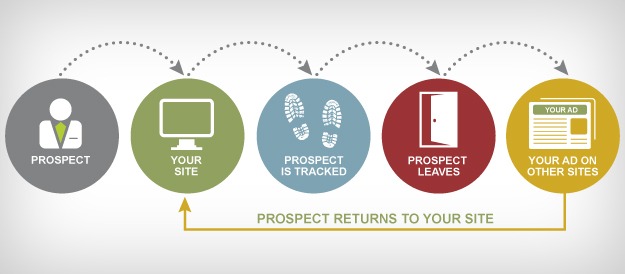
Remarketing is a technique to bring back the visitors who are dropped from the website without completing an intended goal. The image given below explains the remarketing process.
I browsed through my Facebook after a couple of minutes. Without any surprise, I got an offer of 10% discount using remarketing technique on Facebook, as given below.

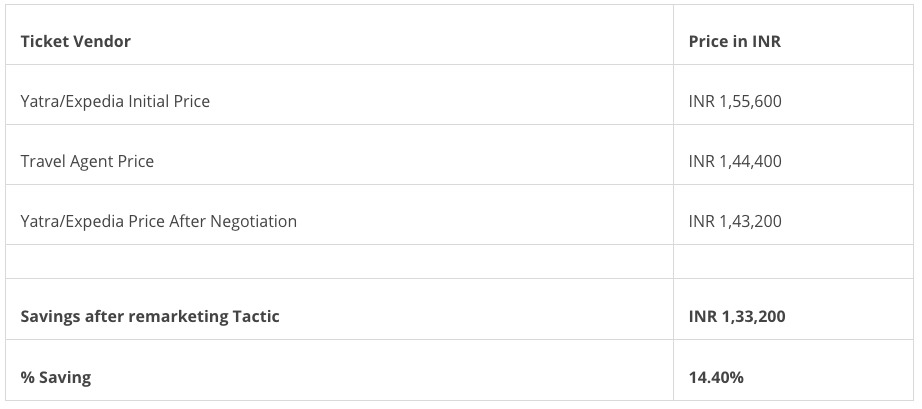
It may sound very fascinating for you, as I was able to save over 14.4% from my initial price. So effectively, I saved around INR 22,400. It is a fairly decent saving for someone living in India. By not doing this process, I would have purchased a ticket at the original price. The detailed savings are explained in the table below. The ticket price includes my wife’s return ticket and my one side ticket.
I have few learnings and advice for marketers as well as the Etihad marketing team. Firstly, I should appreciate the Etihad marketing team for giving me the discount, as it would have gone to an agent if I booked elsewhere. I have a word of advice for Etihad marketing guys. I still have the ad appearing on my Facebook even after completing the transaction. I think they should remove me from the audience list.
Learning and recommendations
- Never book an air ticket without doing enough research
- Remarketing has been one of the greatest tool used by marketers to bring user who has visited the website before. Use it cautiously and don’t annoy users and give clear benefits to bring the user back.
- Discounting is a great way to activate an incomplete transaction, but there are perils attached to it if not used wisely.
- No machine learning system could beat human intelligence. The human brain is hardwired to beat and overcome even the toughest situations.
- Marketers should think of many user journeys and micro-moments to utilise the opportunities to engage prospective buyers.
- If you are doing remarketing, you should build many user journeys as you could, so better targeting and consumer engagement are possible.
- Make sure the user should be removed from the audience list once the visitor completes the purchase.
So, next time you are trying to book travel tickets online, try to research, or simply use the method outlined above. It will surely save you some good money!
This article originally appeared on Track.in

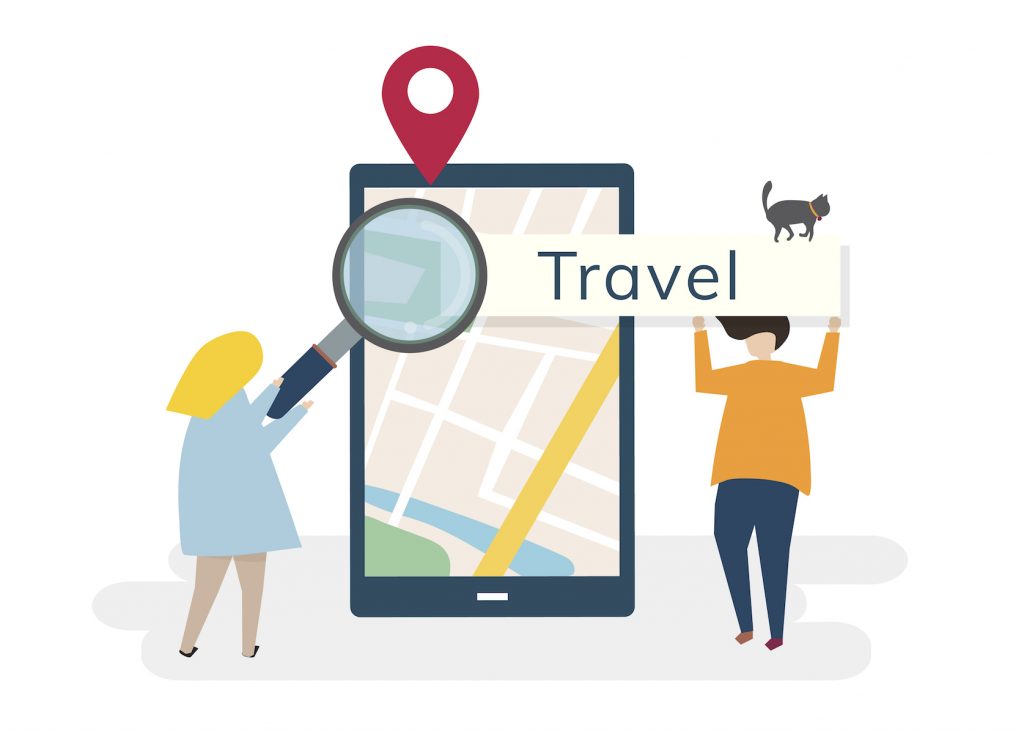
Optimizing Businesses For Better Google Near Me Listings
Near me is a search phrase that throws up accurate and relevant local listings for an establishment or service by Google. Let’s say a user types in ‘hotels near me’. Google will surface the most relevant local listings of hotels near the user’s location.
I recently traveled to Philadelphia’s Old City and wanted to find a good restaurant. I typed ‘restaurants near me’ on Google and it showed up a list of establishments around me, ranging from restaurants serving American cuisine to those specializing in fusion dishes. Such is the power of near me and for many travelers, it can be a life-saver.
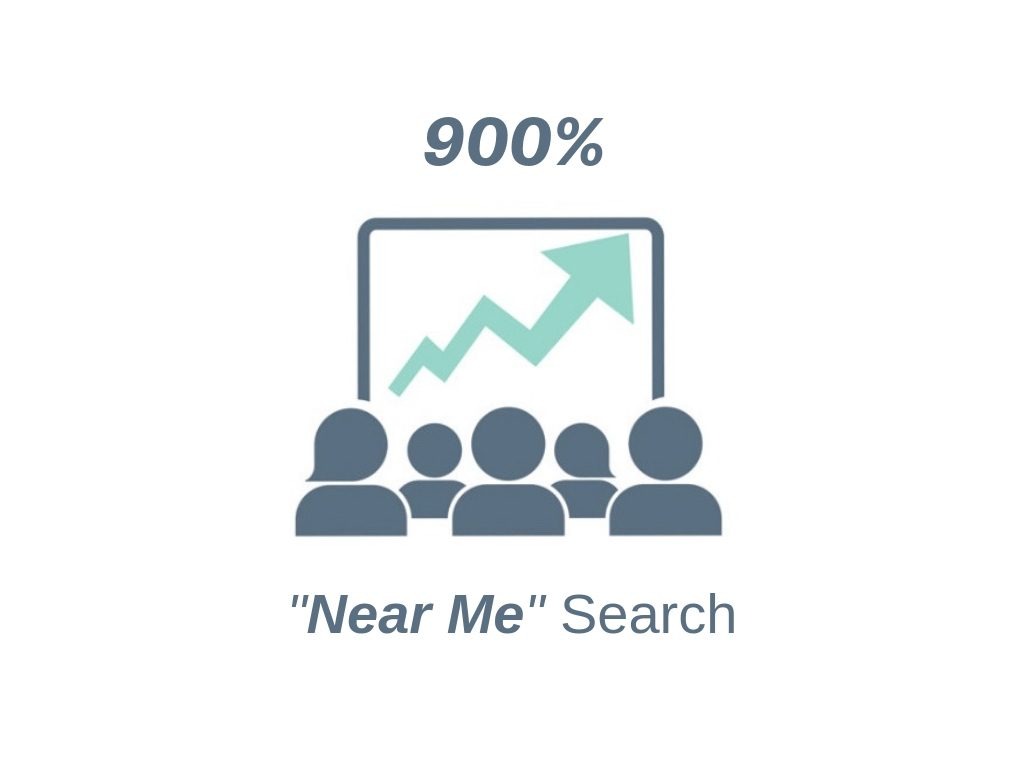
‘Near me’ searches have grown exponentially. According to Google, mobile searches for ‘near me’ grew a whopping 900%+ in the last two years. The searches are becoming more specific and customers are looking for relevant answers. What does this mean for businesses? In order for yours to rank high in local search results, it’s important to understand how ‘near me’ works and how you can optimize your website for higher rankings.
How Google Decides Local Rankings For Businesses
If you have a business, you can’t control when you will show up in ‘near me’ results. However, you can make changes to increase the possibility of showing up. Entering a search for ‘near me’ reveals results based on several factors. There’s a simple reason for this – ‘near me’ searches don’t only depend on how close your business is to the search query. Google does factor in the distance first but it also combines relevance and prominence to determine the most appropriate results. For instance, if Google decides that a business located farther away than yours has what a user is looking for, it will rank it higher than yours in local results.
Distance
Distance refers to how far a potential search result is based on the location of user inputs. If a user doesn’t specify the location, Google will determine the distance based on the user’s whereabouts.
Relevance
Relevance is the next factor Google’s algorithm uses to decide the most appropriate local listings. One of the ways that your business can rank higher in search is to provide complete and detailed info about its services. This helps Google understand your business so that it can match it to search queries.
Prominence
Like the offline world, a business’s prominence plays a vital role in deciding how relevant it is to a search query online. For instance, if yours is well-known it will rank higher in local listings than one that isn’t prominent. This is why it’s common to see certain landmarks, hotels, restaurants and popular establishments listed in search results. However, this prominence is not based on online popularity alone; Google also takes the offline status of these establishments into account.
Positive ratings and reviews of establishments help push them higher up local listings. Google searches links, directories, articles and the like to find out which places are well-known and well-liked. Since search engine optimization (SEO) plays a part in search results, employing sound SEO optimization can make a difference in how well your business shows up in search results.
How To Make Your Business Rank Higher In ‘Near Me’
Competing with popular establishments takes some work. The good news is that it doesn’t cost a lot and can be easily achieved with some changes. Here’s how –
Use Smart Keywords But Not ‘Near Me’
While ‘near me’ is a keyword used to find local listings, it can’t be employed in web copy as it would sound awkward and forced. The next best thing is to use keywords like ‘near’ [street address], ‘nearby [landmark]’ etc. You can start employing these keywords in your About Us and location pages. You should also embed your Google Maps location and provide written driving directions to your business. Web copy should also have other information related to your business’ product or service. For example, if your business liaises or cooperates with the local community you should have content pertaining to the groups and organizations you work with. Additional information in the form of blogs enrich your content and can help increase search rankings.
Optimize Google My Business
Provide complete information on Google My Business as it will help your business show up on local listings. Mention your business’ full address, services, operating hours, photographs and anything relevant. If there’s a change in working hours or your office remains closed on certain days, mention that too. Keep in mind that users can suggest edits and upload photos of your business. Regularly monitor the information given along with that provided by users. Make changes if necessary so that your info remains accurate and updated.
Encourage Online Reviews And Ratings
We’ve mentioned that good reviews and ratings can increase search rankings. Google wants to provide the best results and best search experience for its users, so it’s unlikely that businesses with poor user ratings will rank highly. You can start by asking users for their opinions and responding to the same, whether they’re negative or positive. Emails are the best way to seek reviews. With a well-designed email campaign, you can get the results. Google My Business provides tips that business owners can use to respond to reviews and ratings. Some of them include being polite and not getting personal, keeping replies short, thanking reviewers and avoiding sales pitches. There is review management software such as Podium that you can use to simplify customer interactions and help your business get better reviews.
Consider Other Local Directory Listings
It’s important not to focus only on your website or Google My Business but to expand to other local directory listings. When I searched for studio apartments near me, I found that websites like Groupon and Yelp ranked higher in organic results. Listing management software like Moz Local can help your business rank higher across various local directories and content aggregator websites such as YP.com, Yelp, Better Business Bureau and Apple Maps. They do this by making sure your information is accurate and up-to-date. This keeps your business relevant to search queries.
Optimize Using SEO
SEO optimization is a necessary practice for any business to boost search rankings. While ‘near me’ searches are important and your website should be optimized with this in mind, your overall SEO strategy should be to provide useful, relevant and updated content. The user is focal and providing the best user experience will help your business gain trust and authority with search engines. Blogging on your website about your product/service and guest blogging on outside websites can also bring authority & trust.
In 2010, there were 62 million smartphone users in the US. It’s estimated that the figure will reach 277 million by 2021. Combine that with the number of ‘near me’ searches and you have a good idea of just how important it is for businesses to rank high in local listings. Consider the strategies given here to optimize your website and attract potential customers.
If you’d like to discuss SEO strategies for local businesses in more detail, give us a call.

How Cyberspace Is Joining Hands To Fight Against COVID-19?
The spread of COVID-19, the novel strain of coronavirus, has officially reached pandemic proportions. Doctors, nurses, carers and paramedics around the world are facing an unusual workload in overstretched health facilities. They are working in a stressful and frightening work environment. Communication is everything in this health emergency. Without public health information at our fingertips, many would-be dangerously under-informed about the scale and severity of the issue.
Over the past few weeks, we’ve been seeing that lockdown laws are being imposed on various parts of the world and social distancing is being promoted. The Internet & Internet Related Services are enhancing lives by acting as a vital public service and connecting people in creative and positive ways. It is both a lifeline and a crucial force in helping to control the spread of the virus, providing important public health information and helping us live virtually when meeting physically threatens human lives.
However, at present, we’re not only fighting an epidemic but also an infodemic. Fake news, medical misinformation and conspiracy theories spread faster and more easily than the virus, and is just as dangerous. To control this, the internet’s largest social network companies have issued a joint statement on the coronavirus COVID-19 outbreak. They have promised to fight the fraud and curb misinformation shared on their platforms. Facebook, Google, YouTube, LinkedIn, Instagram, Twitter, etc co-signed the statement. These platforms are also providing free access to coronavirus news.
In this blog, we are discussing the major steps social media platforms have taken to get critical information to their billions of users.
Google has launched a website, developed in partnership with the governing bodies of respective governments, to provide information and resources about the pandemic. It includes prevention tips, a map of areas affected by the outbreak and links to local health agencies, which are available in different languages.
For people specifically looking for information about symptoms, prevention or treatments, they have included a COVID-19 knowledge panel.
Google searches related to coronavirus show an “SOS Alert” banner, followed by news from mainstream outlets and information from recognized health organizations and governments.
As part of the measures taken to give out reliable information during this pandemic period, Google has disabled app searches for ‘coronavirus’ on Google Play Store, their mobile app store. They are also removing misleading information and fake reviews about healthcare locations from Google Maps, using a combination of automated and manual review systems.
In addition to that, Google My Business will not be publishing any new reviews, review replies, or new Q&A until further notice whereas existing reviews, review replies, and Q&A will be visible. This is because they want to make sure that the information provided is valid and from trusted sources. Their support team will prioritize reviewing new listings, claims, and verifications for critical health-related businesses only. Since Google is prioritizing critical services, other types of businesses can expect a delay in the publication of new listings, claims, and verifications.
As the world’s largest social media platform, Facebook is running a ‘Coronavirus Information Center’ for better information sharing with their audience. It is an initiative to help people find information and tips, on top of existing measures introduced to beat scams, ads and other sources of misinformation. When users search for ‘coronavirus’, Facebook shows a banner directing them to the WHO or their national health organization. Ads that attempt to exploit the outbreak by selling ‘miracle cures’ or medical face masks at grossly raised prices are banned.
Facebook has created a Messenger Coronavirus Community Hub with tips and resources to help users recognize scams and misinformation and prevent their spread. As people spend more time online due to social distancing measures, Facebook also launched its digital literacy program named “Get Digital” to help young people develop the necessary skills to safely navigate the internet.
Youtube
YouTube has also promised to promote verified, informative videos of coronavirus information on its homepage. YouTube has also promised to promote verified, informative videos of coronavirus information on its homepage.
[su_youtube_advanced url=”https://www.youtube.com/embed/9cfYC4YLsu4″ autoplay=”yes” mute=”yes” loop=”yes” rel=”no”]
YouTube has introduced information panels from the WHO or to their national health organizations which appear when you search for coronavirus. It is also providing governments and NGOs with free ad space and removing harmful medical misinformation videos. Since most of the people are working from home or either use watching videos for spending their time due to quarantine they have cut down the video quality from HD (1080p & 720p) to SD (480p) to reduce traffic on mobile and broadband networks.
Similar to Facebook and YouTube, Twitter directs users to national health organizations when they search for coronavirus-related terms. It has also pledged to ban ads that exploit the outbreak. Twitter updated its safety policy to announce that it would ban tweets that “could place people at a higher risk of transmitting COVID-19”. The new policy bans tweets denying official guidance, including encouraging “fake or ineffective treatments, preventions, and diagnostic techniques” and misleading posts that pretend to be from authorities or experts. However, they won’t be able to take down every tweet containing misleading coronavirus information. Twitter has promised to provide NGOs with advertising credits to support public health campaigns.
Rumors and lies are reportedly running wild in WhatsApp group chats, including through the medium of voice notes. However, due to the Facebook-owned messaging platform’s heavily encrypted structure, these communications can’t be monitored or moderated. But the Facebook messaging service launched the WhatsApp Coronavirus Information Hub, working with the WHO, UNICEF and UNDP to keep its global users informed about the pandemic and thus they can limit the spread of rumors.
WHO launched a chatbot on WhatsApp to help users get accurate information. The service will be available in Arabic, Chinese, French, Russian and Spanish. As well as launching a WHO chatbot, WhatsApp has expanded its collaboration with governments to provide information services on the coronavirus, with the UK and India teaming up with the messaging app to provide information services.
Similar to Facebook, Instagram is also blocking and restricting coronavirus hashtags by rerouting users to public health organizations. A search for #coronavirus shows a pop-up redirecting users to the Centers for Disease Control and Prevention website. Facebook launched a new system, “proactive sweeps” that will remove other hashtags spreading misinformation on Instagram. Instagram is banning ads that exploit the crisis. It has also banned users from searching for filters with COVID-19 themes unless they were made in partnership with recognized health organizations.
Besides this, the platform has added educational resources in Instagram Search, as well as stickers promoting accurate information. Instagram has also expanded its donation sticker to more countries to help connect users with nonprofits. They have created a “Stay Home” shared story encouraging those practicing social distancing to virtually connect.
In this extreme case of COVID-19 interventionism, the Chinese social media and the messaging app has been widely censoring coronavirus-related content, including critical and neutral information. With broad censorship rules that block messages containing hundreds of coronavirus keywords and keyword combinations.
TikTok
The most popular video-sharing app across the world, Tik-Tok has guidelines that prohibit content that could be harmful. Like all other social media platforms, when users search for ‘coronavirus’ they are presented with a WHO banner.
In the midst of a public health crisis, not only health workers but all major social media platforms have become an important player during the coronavirus outbreak. Social media platforms are finding ways to offer authoritative information to help people. The most effective way to fight this spread is for everyone to practice social distancing while being virtually connected
How Ayruz helped Oldcastle Infrastructure to create a new user experience for their CPQ-based customer portal?
Oldcastle Infrastructure is the leading provider of engineered products and accessories for building and construction in the USA. They are part of CRH Plc (LSE: CRH), the world’s leading building materials business. Together, they go beyond their products and services and bring value to the community, building not just physical structures but also a better society.
Keeping in mind the core business and values of Oldcastle, Ayruz USA collaborated with the Oldcastle team to build a tool aligned with these goals.
The objective:
Ayruz advantageously brings industry knowledge and an in-depth understanding of the client’s business and how to improve the metrics that matter, keeping the client’s overall business objectives central. With that in mind, the CPQ tools and everything that tags along with it became a solution mastered by the Ayruz team, facilitating teamwork, improving customer experience, and accelerating the process that usually takes more time and effort.
Oldcastle had a legacy configurator portal in which customers could make product configurations, but the users were facing numerous issues in accomplishing their needs. With that in mind, Ayruz weaved a strategy that:
- Understands and resolve bad user experiences;
- Address key customer needs with the new Portal;
- Look through the customer lens and understand their behavior. We practice the “Think like a Customer” mindset, understand the manufacturing activities, the products, their application, the information customers seek before purchasing these tools, and map the consumer journey in its entirety;
- Navigation that enables the guided purchase of stormwater products;
- Develop best practices, guidelines;
- Execute UX, UI, and layout best practices;
- Capture and track leads via Salesforce;
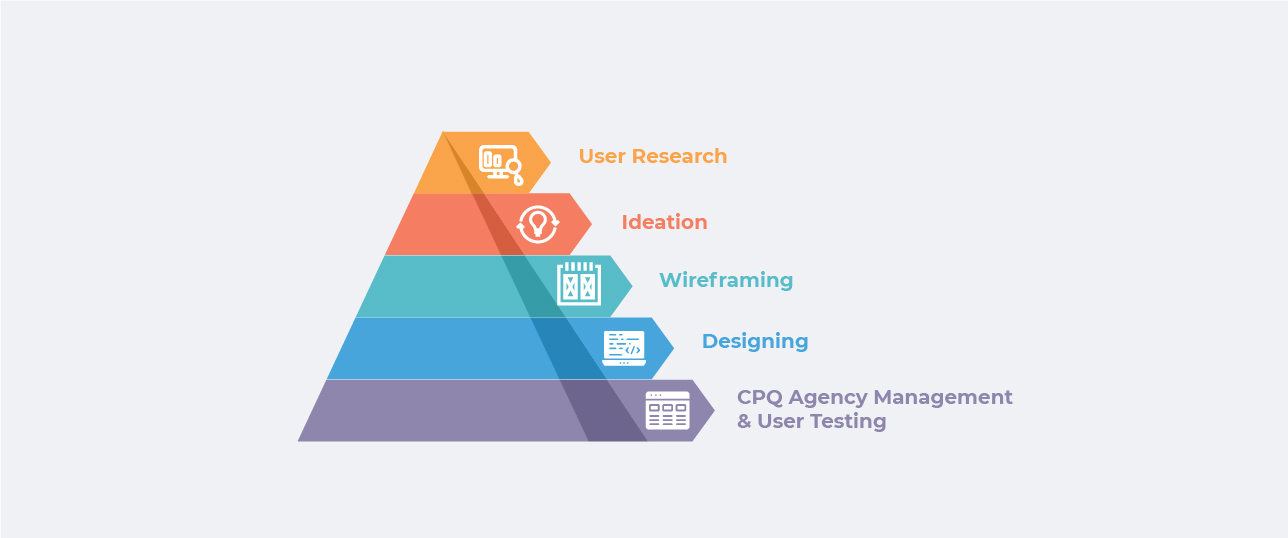
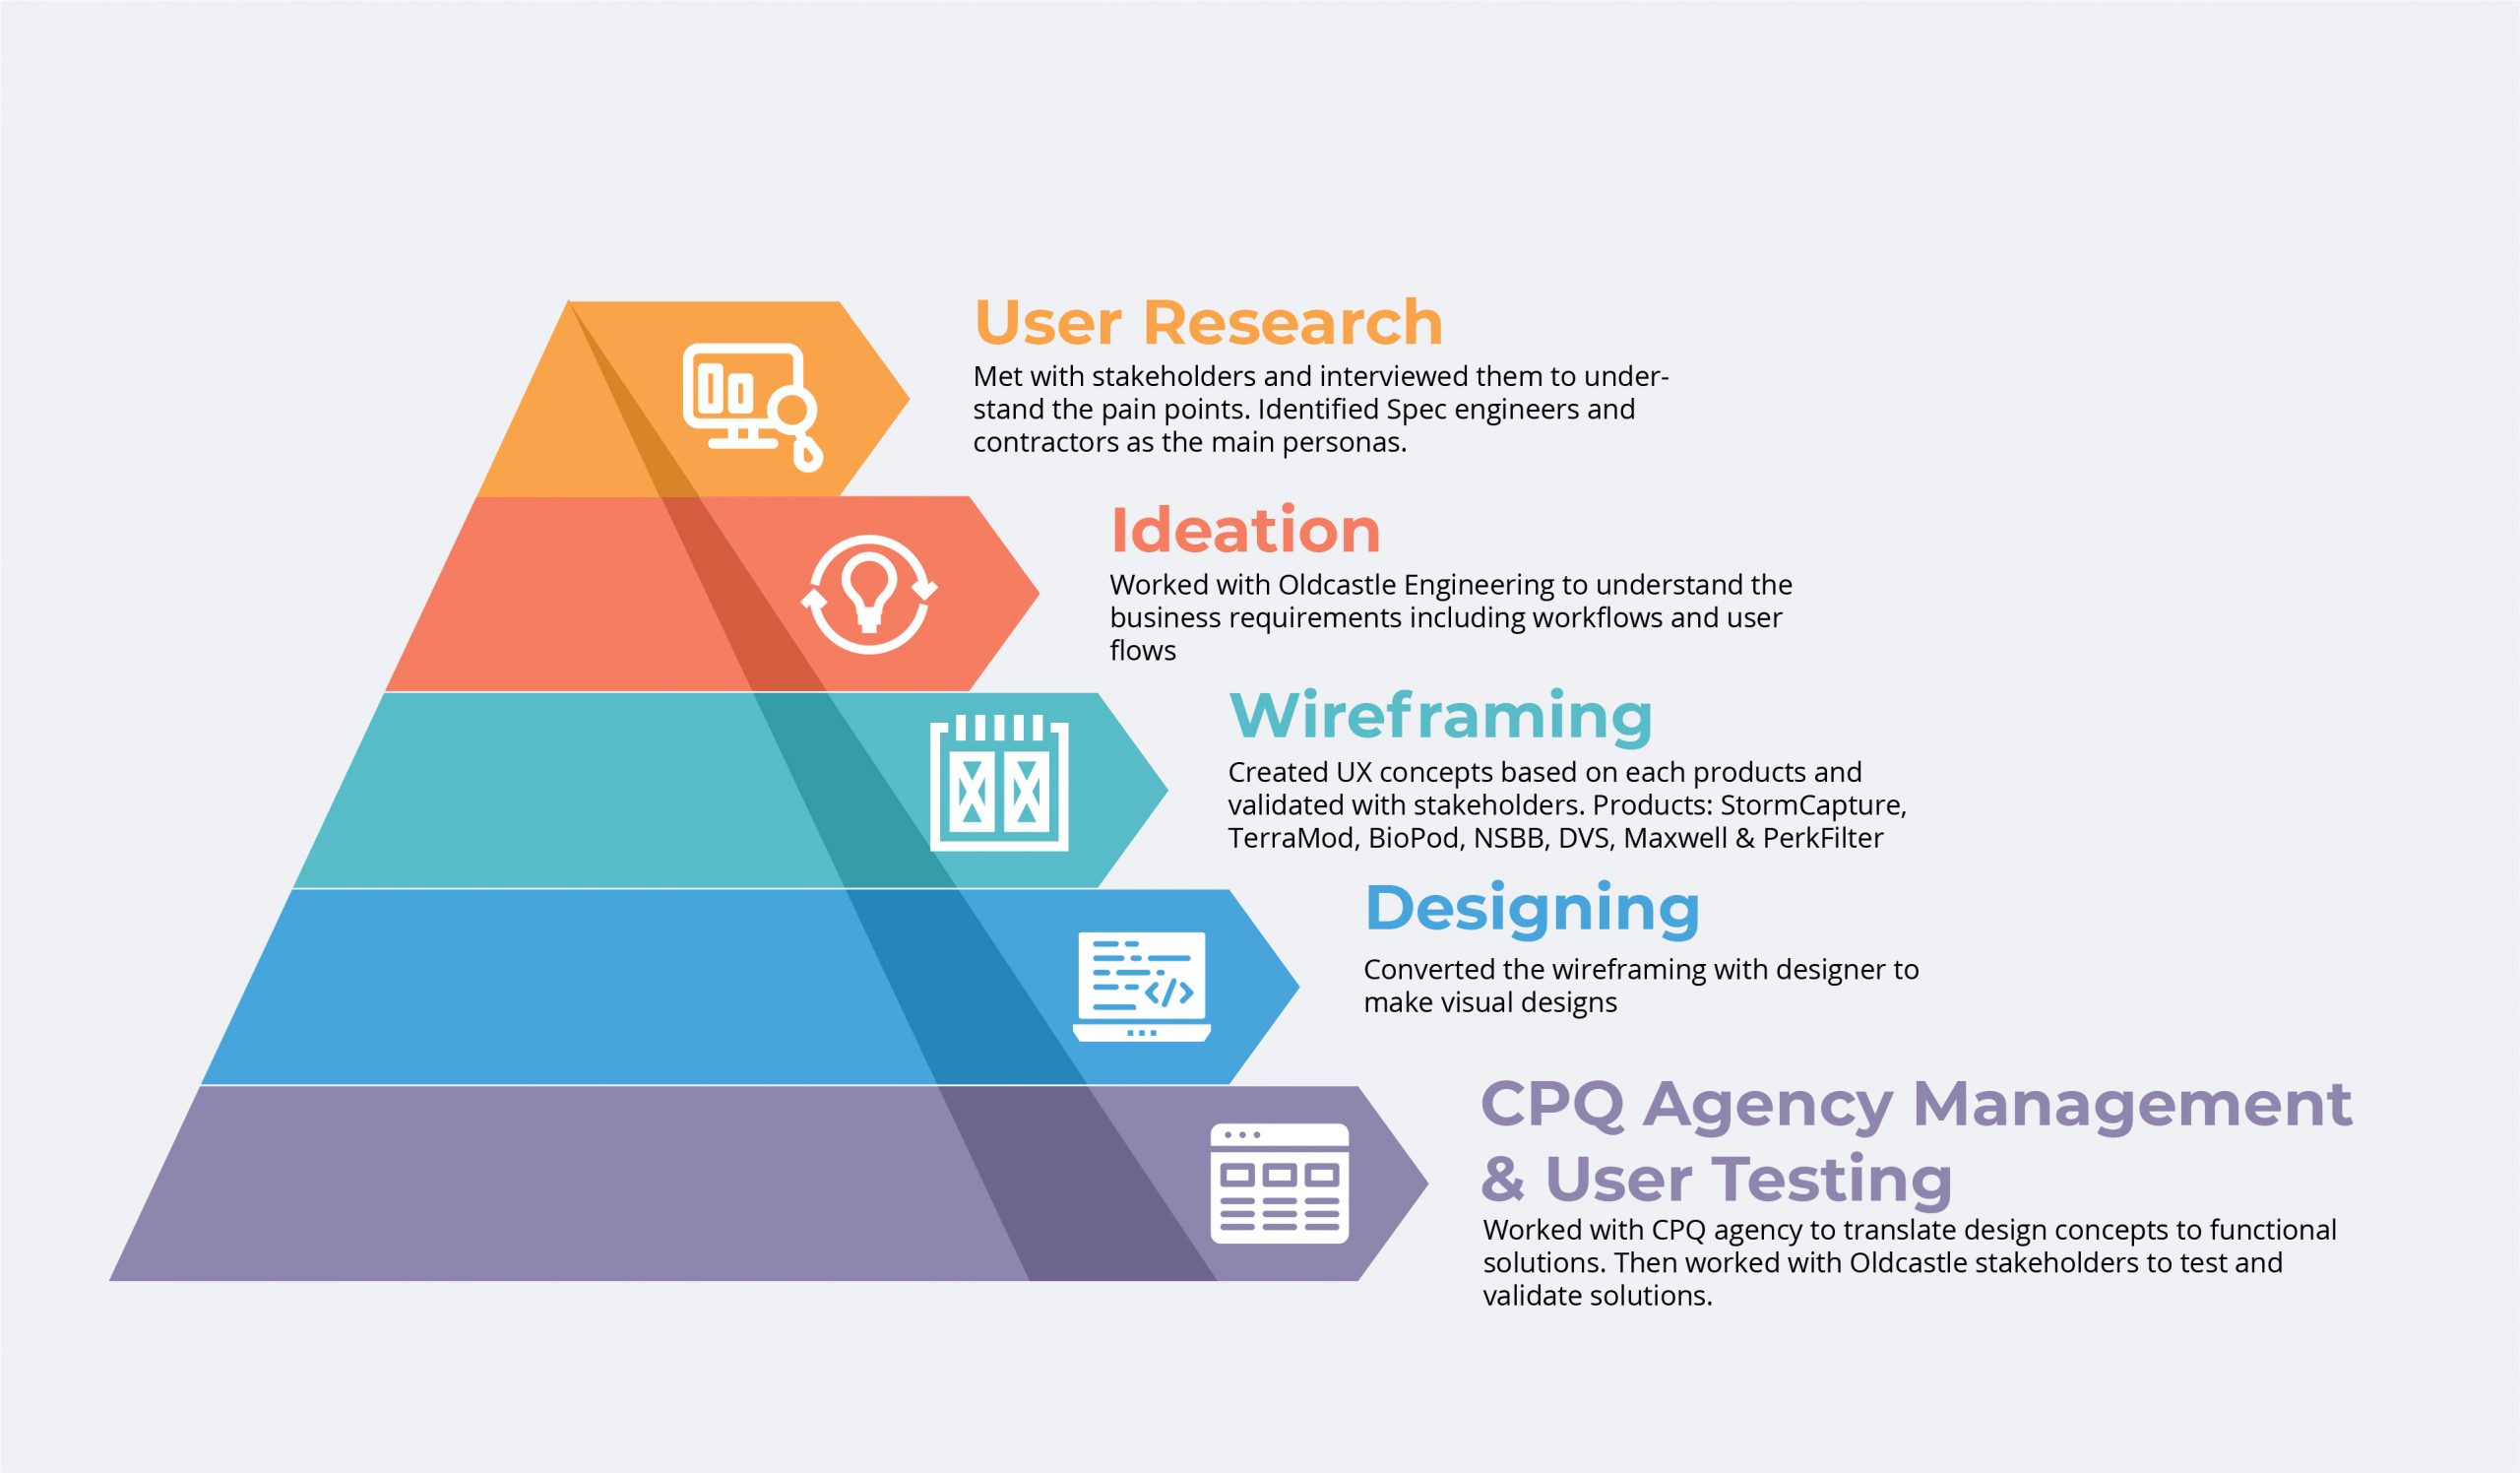
The Process:
To start this project, Ayruz first interviewed stakeholders and understood their experience with the existing Portal and their pain points; then, it was necessary to talk to Oldcastle Engineers to understand the business requirements and acquires the knowledge to understand and build a better Portal based on their workflows and user flows.
To come up with the best solution, Ayruz created a UX concept based on product specificities and validated the design work with stakeholders. Wireframes were presented during the whole project, bringing visual designs in all steps of development and continuous work along with the CPQ agency to translate design concepts into functional solutions.
A weekly meeting with Oldcastle stakeholders ensured everybody was on the same page during the entire project by testing and validating the solutions. The customer-centric project had expectations, and Ayruz made sure to meet them.
Top-down user experience approach
The experience Ayruz delivered on the Portal on the Oldcastle website speaks for itself.
To illustrate further, Ayruz started with the User Dashboard, giving the customer the possibility to easily see and follow their many projects:
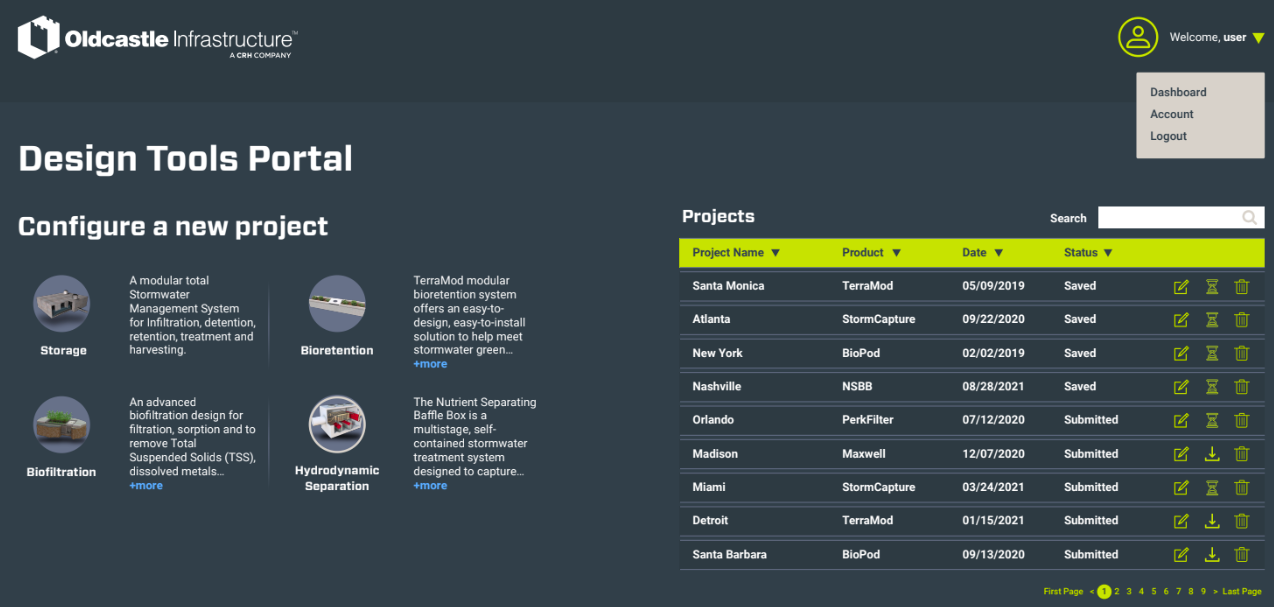
Based on the Customer Portal Experience Ayruz designed a Dashboard focusing on the user needs.
After having identified the user need, a System Parameter (Image from Maxwell Tool) was also developed and designed accordingly:
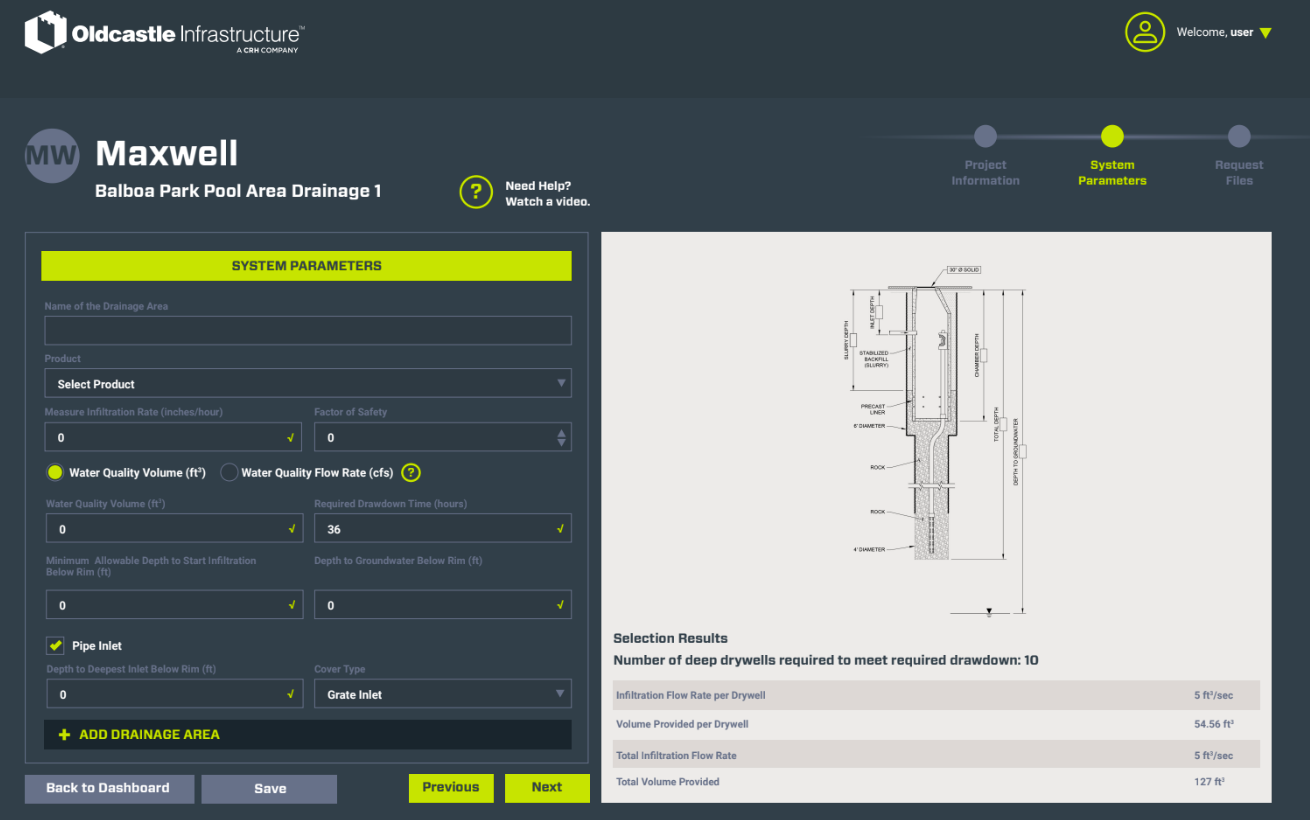
It is essential to mention that Ayruz not only did the user-centric layout, UX and UI, but the Ayruz team had knowledge about the complex engineered Tools functionalities and their applications. That means that every box included in this System Parameters is based on the customer’s needs: to know about the water quality volume, the flow rate, minimum allowed depth, and compliance particularities of each state.
It is not just about what we can see in the pages developed for Oldcastle Infrastructure; it is also about the mindset behind it, compliance rules for each region, and tools parameters for customers’ buildings and construction.
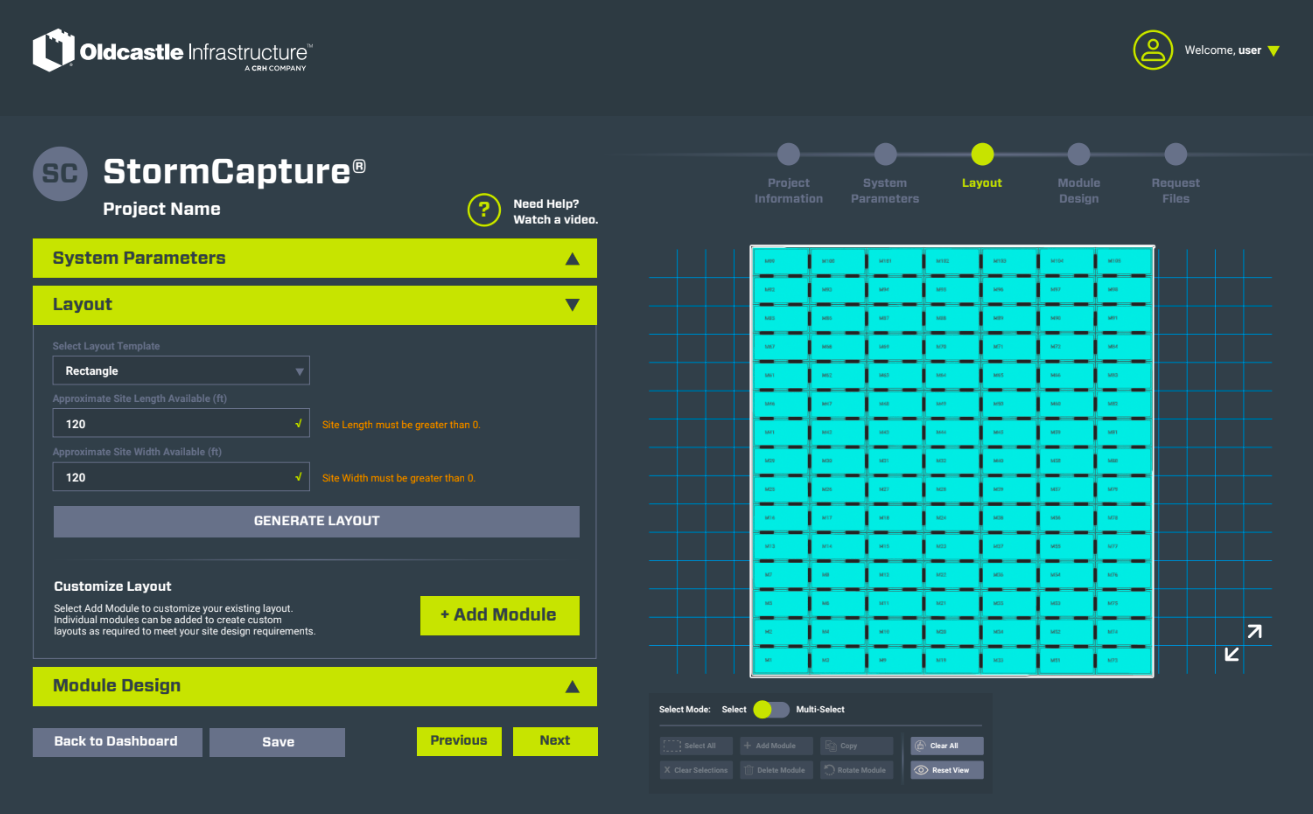
Layout (Image from StormCapture Tool)
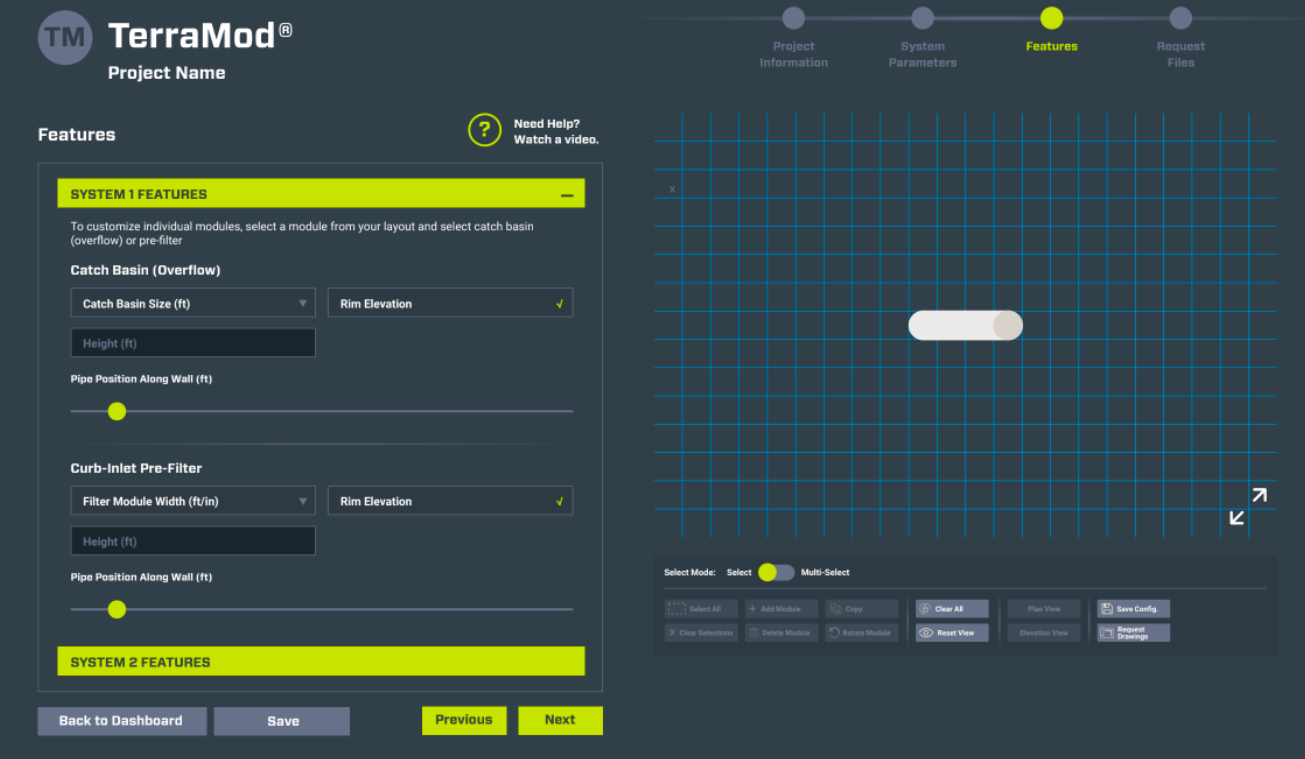
Features (image from TerraMod tool)
Like every project Ayruz undertakes, we take ownership and go well beyond the finishing line.
The goal was to revamp a legacy configurator Portal for customers, and Ayruz deep-dived into it. In the end, the selling of products and capturing/tracking leads through Salesforce exceeded customer expectations.
The bottom line is, Ayruz doesn’t merely treat the customer or a project in a typical sense. Instead, Ayruz works closely as a partner with industry and business experience. And in this case, Ayruz did not just build a Customer Portal, but a Customer and Sales Solution, a productive system with a quality layout, adding value to all the stakeholders involved with the tool.
Social Media Post from Oldcastle
Testimonial

Mark Skinner, Sr Manager Digital Marketing
“Ayruz has been our partner leading the UI/UX design for our newly enhanced suite of CPQ digital tools. Sanil and his team have a deep understanding of our manufacturing industry and is familiar with the complexity of our products. Ayruz has been instrumental to the design of our tools allowing our customers to configure their products to meet jobsite requirements, and deliver an overall outstanding digital experience.”
Main Highlights:
Goal
To develop a new Portal that has all the customers’ needs attended to, understanding not only Oldcastle core business, but also their customer’s behavior and their journey in entirety.
Partnership
Oldcastle Vendor since 2021
Industry’s most complete and user-oriented Portal
User-centric design, UX, and UI. Enable faster customer quotation and access to quality information, accelerating and simplifying the process for the Sales team. A work tool for both sides: customers and the business.
If you are looking for a vendor for your digital needs who understands your industry, business, and goals and who comes with a partner mindset, you can talk to us at Ayruz to discern the value we bring.
We dedicate time to understanding your activities and needs, putting your customers in the center, and then bringing you solutions to the problems and helping execute them. Talk to us for a free consultation.
From VOC, and VOS, to developing portals, revamping websites to digital strategy, marketing data intelligence, and planning, Ayruz brings a 360º overview of your business and helps accelerate your growth by leveraging digital.
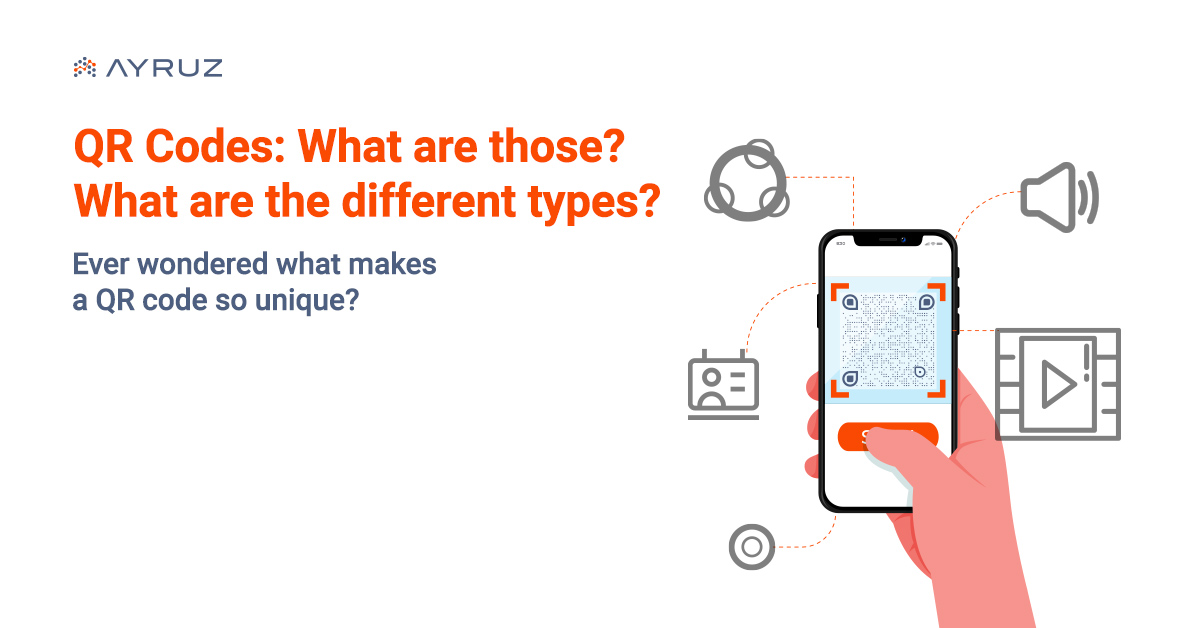
QR Codes: What are those? What are the different types of QR codes?
Ever wondered what makes QR codes unique?
Over the pandemic days, you might have come across several types of contactless payment modes which assist in maintaining social distancing, such as tap n pay, QR codes, etc. While the tap-n-pay feature would be primarily available in high-end devices, QR codes enabled a significant chunk of users to facilitate contactless payment. But have you ever wondered what makes QR codes so unique? And are QR codes only good for payments and nothing else?
Well, with this article, we’re trying to discuss the QR codes and the different types of QR codes.
What is a QR Code?
A Quick Response Code or QR code is a machine scannable 2D barcode that stores a particular type of information. Usually, the data stored can be text, image, audio, video, addresses, or URL.
Why QR code?
Earlier, dedicated QR code reader applications were used to scan the codes and reveal the information within; however, at present, smartphones have become so smart that just the dedicated smartphone camera can deduce the QR codes and disclose the information. Hence, it has quickly become the most accessible mode of information disbursal. Furthermore, due to the pandemic, the receptibility of QR codes has increased significantly on a global scale. The eMarketer – Insider Intelligence Report estimates that the number of smartphone users in the United States scanning a QR code will increase from 83.4 million in 2022 to 99.5 million in 2025!
What are the different types of QR codes?
Based on the type of data stored, QR codes can be classified into:
Text QR codes: stores simple text characters displayed when scanned.

Image QR codes: Stores a particular image that can be accessed when scanning.
Audio QR codes: Stores audio files.

Video QR codes: Plays a video when scanned.

Contact QR codes: Stores address and other contact details.

Based on the data being stored, a different classification of the QR codes also exists, which is Static & Dynamic QR codes.
Static QR codes are those where one data type is encoded. We cannot change that information in between.
Dynamic QR codes, on the other hand, are more sophisticated QR codes where we can program the data or the destination at any time as per our convenience.
Difference Between Static & Dynamic QR Codes
The key difference between static and dynamic QR codes lies in the data encoding and accessibility. As you’re aware, the data stored in Static QR codes cannot be changed.
However, for dynamic QR codes, you have the flexibility to modify the end destination as per your requirement. If you’re using them for your consumer campaign, you can even track the unique QR codes and obtain advanced-level insights.
Generation of Static & Dynamic QR Codes
Usually, most third-party QR code generators can generate static QR codes of any type without complexity since the encoding method is simple. Hence, we can come across many free tools.
It gets tricky when we’re talking about dynamic QR codes through. Enterprise customers mainly use dynamic QR codes with specific requirements, such as QR code-based payment methods and consumer loyalty campaigns. Hence, the QR code generator tools, such as Ayruz’s own DynaQR, offer customized solutions tailored to the customer’s needs.
How can I evaluate whether the QR codes suit my marketing campaign?
Well, if you’re looking to evaluate whether QR codes are suitable for your next marketing campaign, you all have to write to us here. We’d happily offer you a free consultation and guide you further.
Five tips for running an effective consumer engagement campaign!
Suppose you’re a brand owner of an FMCG company, an e-commerce company, or an FMEG company that directly sells its products or services to consumers. In that case, you certainly know how crucial customer data is for your brand, correct? From time to time, you will have to ensure that the vision put forward by your company is in sync with the requirements of your customers. Only then can you be sure that the product or the brand you represent will be capable of scaling more heights.
To maintain an ongoing, evolving relationship with the consumers, a brand can opt for many mediums, such as:
- Work with intermediaries such as dealers or distributors to collect customer insights.
- Hire an independent consultancy to interview customers spread across specific pre-defined demographics
- Conduct consumer engagement and awareness campaigns that interact directly with the end consumer.
The most effective way to build a relationship with the end consumer is to conduct engagement and awareness campaigns that interact directly with them without intermediaries. Let us discuss the key points a brand owner, such as yourself, can keep in mind when running a consumer awareness campaign.
Have simple steps for participation

It may seem like a straightforward step; however, most of the time, failure to not complying with this step has proven fatal to engagement campaigns run by many brands. Furthermore, if the engagement campaign involves many steps for the consumer to complete, there is a high chance of getting bored before completing the tasks and dropping out. Therefore, we can witness higher completion rates if we simplify the steps.
Have an exciting rewards structure

When running a consumer engagement campaign, we must clarify what the consumer receives. There are many ways with which we can reward the consumer, such as:
- The overall experience itself
- Chance to act as ambassadors for the brand
- Gift Vouchers
- Free Samples
- Mega Prizes
If the gratification is not appealing, there are high chances for consumers to lose interest in participation quickly, and it can also result in drop-offs.
Have a user-friendly medium for interaction
Suppose you’re running an engagement campaign surrounding your FMCG product and wish to direct people to a particular microsite. There are many ways you can achieve the same. You can:
- Conduct print campaigns where you can display the URL for sharing with the customer.
- Post the URL in your social media feeds.
- Print the URL in your product packaging for users to type in their browsers.
- Display a dynamic QR code in the product packaging that is generated using customizable QR code generators like dynaQR, which Ayruz powers.
If you’re looking for the most convenient medium for running an engagement/awareness campaign, then displaying a QR code on the product would be the right way to proceed. It is because the user need not type in the URL, or the brand does not have to chase the consumer with the link.
Have a kick-ass style of presenting content

In consumer engagement campaigns, brands often check all aspects above, but they accidentally ignore the content written for communicating with the audience. It would be rather plain or uninteresting and will not generate a sense of excitement in the audience for participation. Sometimes, the text content will be exciting; however, the way it is presented, the design, etc., will be uninteresting. That also can dampen the excitement of the participant. Finding the right mix of engaging content and kick-ass visual elements can be critical for pumping up the excitement level of participants.
Have an always-on support mechanism
When brands often run consumer engagement mechanisms, customers will encounter glitches or need additional support from the organizers to resolve their queries correctly.

Sometimes, their entry may not be accepted, or a gift voucher didn’t reach them due to technical issues.
At those times, if a proper support mechanism is in place, customers will get prompt resolutions, and that pleasant experience, in turn, will aid in turning that customer into a loyal one.
The prime objective for a brand, while executing a consumer engagement campaign, must be to forge a lasting relationship with its loyal customers. If you’re looking for ways to engage with your customers, feel free to write to us by clicking here. We’d love to discuss and assist you in developing your next kick-ass engagement campaign!
Universal Analytics vs Google Analytics 4: A Comparison
Web analytics has become essential to digital marketing, helping businesses gain insights into their website’s performance and user behaviour. With the evolution of analytics platforms, Google has introduced a new version called Google Analytics 4 (GA4), which brings significant changes compared to its predecessor, Universal Analytics. Here, we will explore the differences between Universal Analytics and GA4, focusing on key points such as app tracking, hit types, session calculations, exports to BigQuery, bounce rate and engagement rate, the importance of Google Tag Manager, and account structure.
- App Tracking: One of the significant differences between Universal Analytics and GA4 is the ability to track apps. While Universal Analytics primarily focuses on web tracking, GA4 provides enhanced app-tracking capabilities. GA4 allows businesses to track user behaviour within their mobile apps, including in-app events, screen views, and conversions. This feature enables businesses to gain insights into user engagement and retention within their apps, making GA4 a more comprehensive analytics solution for businesses with mobile apps.
- Hit Types: Hit types are how data is sent to Google Analytics for measurement. In Universal Analytics, hit types include pageviews, events, social interactions, e-commerce transactions, and more. However, in GA4, the concept of hit types has been simplified and replaced with events. Events in GA4 can capture various interactions, including pageviews, clicks, video views, scroll depth, and more. This streamlined approach allows for easier implementation and more flexibility in tracking user interactions.
- Session Calculations in GA4 vs Universal Analytics: Sessions are the periods of time in which users interact with a website or app. In Universal Analytics, a session is defined by default as 30 minutes of inactivity or the end of the day. However, in GA4, the concept of sessions has changed. GA4 uses an event-based model, where a session is a collection of user interactions with the same session ID, regardless of the time interval between interactions. This means that in GA4, a session can span across multiple days, making it more flexible and better suited to track user behavior in the modern multi-device, multi-channel digital landscape.
- Exports to BigQuery are free with Google Analytics 4: Another notable difference between Universal Analytics and GA4 is the ability to export data to BigQuery, Google’s cloud-based data warehouse, for advanced analysis. In Universal Analytics, exporting data to BigQuery requires a paid integration with Google Analytics 360. However, in GA4, data exports to BigQuery are free, making it more accessible for businesses to analyze and gain insights from their data in a powerful and scalable data warehousing solution.
- Bounce Rate and Engagement Rate: Bounce rate is a metric that measures the percentage of users who leave the website after viewing only one page, while engagement rate measures the level of user interaction on a website. In Universal Analytics, these metrics are calculated based on pageviews, while in GA4, they are calculated based on events. This means that in GA4, businesses can have more accurate and granular insights into user engagement. Events can capture interactions beyond pageviews, such as clicks and video views.
- Google Tag Manager is more important than ever: Google Tag Manager (GTM) has always been a valuable tool for managing tracking codes and implementing analytics on websites and apps. However, with the introduction of GA4, GTM has become even more important for businesses that want to make the most of their data-driven strategies.
One of the key reasons why GTM has gained increased importance with GA4 is the shift toward an event-based tracking model. In GA4, events are the primary data points tracked, replacing traditional pageviews and other hit types in Universal Analytics. Businesses must carefully configure and manage their events in GTM to ensure accurate tracking of user interactions, conversions, and other important events.
GTM also allows businesses to implement GA4’s enhanced app tracking capabilities easily. With GA4, businesses can track user interactions within their mobile apps, such as button clicks, in-app purchases, and app opens. GTM simplifies adding event tracking codes to the app’s source code, making it easier for businesses to implement and manage app tracking in GA4.
Furthermore, GTM allows businesses to adapt and update tracking configurations without changing their website or app’s source code. This means businesses can easily update their tracking setup, add new events, and make other changes as needed, all through the GTM interface, without requiring developer involvement. This agility and flexibility make GTM a powerful tool for businesses that want to quickly iterate and optimize their tracking setups based on their evolving data needs.
In addition, GTM offers a robust testing and debugging environment, which is essential for ensuring that tracking codes are working correctly and data is accurately captured in GA4. Businesses can use GTM’s built-in preview and debug mode to test their tracking configurations and troubleshoot any issues before deploying changes to their live website or app.
Overall, GTM has become more important than ever with GA4, providing businesses with the necessary flexibility, agility, and testing capabilities to implement and manage their event-based tracking setup effectively. It allows businesses to efficiently configure and deploy tracking codes, test and debug tracking configurations, and adapt their tracking setups. It is a crucial tool for businesses that want to maximize the benefits of GA4’s advanced analytics capabilities.
- Better Search With the GA4 Search Bar: Another notable feature of GA4 is including a search bar within the platform. This search bar allows users to easily search for specific events, conversions, or other data points within their GA4 account, making finding relevant information more efficient and convenient. This feature is particularly useful for businesses with large amounts of data or complex tracking setups. It allows for quicker and more precise searches, making data analysis and reporting more streamlined.
- Account Structure: The account structure in GA4 has also been updated compared to Universal Analytics. Universal Analytics’s account structure consists of accounts, properties, and views. However, GA4’s account structure is simplified to just organizations and properties. Organizations serve as top-level entities and can have multiple properties representing the websites, apps, or other tracked digital assets. This updated account structure gives businesses a more streamlined and organized approach to managing their analytics properties, making setting up and managing to track multiple assets easier.
Conclusion: If you’re considering switching to GA4, partnering with a GA4 agency can help you navigate the complex migration process and fully leverage the platform’s capabilities. In conclusion, GA4 introduces significant changes and improvements compared to Universal Analytics. With enhanced app tracking capabilities, streamlined hit types, event-based session calculations, free exports to BigQuery, updated metrics like bounce rate and engagement rate, the increased importance of Google Tag Manager, and improved search capabilities within the platform, The web analytics approach provided by GA4 is more modern and comprehensive in comparison to Universal Analytics. However, the transition from Universal Analytics to GA4 may require businesses to adapt their tracking setups and familiarize themselves with the updated features and account structure. A GA4 agency can provide guidance and expertise to ensure a smooth transition and help businesses fully leverage the capabilities of GA4 for their data-driven decision-making. To fully utilize GA4’s potential, companies must thoughtfully evaluate their particular needs and preferences when deciding between Universal Analytics and GA4 and plan a seamless transition accordingly.
How is bounce rate calculated in GA4 and what replaces the bounce rate in GA4?
Analyzing website performance has always involved a crucial metric – bounce rate. But with the arrival of Google Analytics 4 (GA4), things have changed., there have been significant changes in how bounce rate is calculated and interpreted. In this article, we will explore the revised method of calculating bounce rate in GA4 and discuss the new metric that replaces it.
What is Bounce Rate?
The bounce rate is a metric intended to indicate the level of engagement among visitors to your website. In Analytics, a bounce occurs when a visitor arrives on your website but doesn’t navigate to other pages before leaving. The higher the bounce rate, the worse it is.
For example: Let’s say you have four visitors to your website. Two of them only look at one page each and leave, while the other two explore two pages each before leaving. In this case, your bounce rate would be 50%. Half of the visits resulted in only a single page view.
- The bounce rate is the percentage of website visits where users only viewed one page and did not interact further or request additional information from the Analytics server.
- An engagement event is any event that indicates user interaction with your website or app.
- You can define these events, consisting of various actions such as viewing pages, clicking on elements, submitting forms, playing videos, and more.
- By default, the engagement events in GA4 include page_view, scroll, search, and ad_click.
Traditionally, in previous versions of Google Analytics, bounce rate was calculated based on a single-page session, where a user’s interaction was limited to a single pageview.
How is the bounce rate calculated in GA4?
GA4’s approach to measuring bounce rate has undergone a fundamental shift. Instead of relying solely on single-page sessions, GA4 introduces a more nuanced concept known as “engaged sessions.” To calculate the Bounce rate in GA4, divide the number of single-engagement sessions by the total number of sessions and multiply by 100 to get the percentage.
Bounce Rate = (Single-engagement sessions / Total sessions) * 100
Engaged Sessions and Bounce Rate: An engaged session in GA4 is where a user interacts with the website or app for a certain duration or performs an event that indicates active engagement. This includes scrolling, clicking on a link, playing a video, or submitting a form. Consequently, a session with a single pageview can still be considered an engaged session if the user spent a significant amount of time on that page or completed a valuable action.
What replaces the bounce rate in GA4?
- In Google Analytics 4 (GA4), the concept of bounce rate used in Universal Analytics is replaced by the concept of engagement rate.
- In GA4, the concept of a “bounce” is different from Universal Analytics. In Universal Analytics, a bounce was recorded when a user only viewed a single page of your website. In GA4, a bounce is recorded when a user exits a session after a single engagement event, regardless of the number of pages viewed.
- When GA4 was introduced, a new metric called engagement rate was also introduced. In simple terms, the bounce rate is the opposite of the engagement rate (100% – engagement rate).
- Remember that GA4 provides a more event-driven and flexible approach than Universal Analytics, and you can define your own engagement events based on your specific tracking needs.
What is the Engagement rate in GA4?
- The engagement rate is a valuable metric for evaluating the effectiveness of your content, user experience, and overall website/app performance in terms of engaging and retaining visitors. It helps you identify areas where user engagement can be improved and informs strategies for enhancing the user experience.
- It provides insights into how actively users engage with your content beyond single-page visits.
- By considering both the duration of the session and the occurrence of multiple engagement events, GA4’s engagement rate provides a more comprehensive understanding of user engagement and involvement compared to the traditional bounce rate. A higher engagement rate indicates that users actively interact with your website or app, explore multiple pages, spend more time, and potentially take desired actions, such as conversions or completing goals.
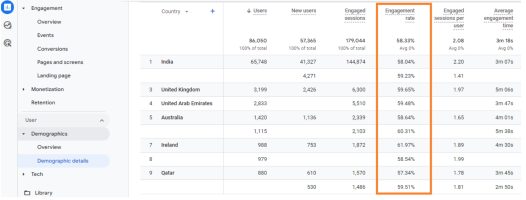
- In Google Analytics 4, you can locate the engagement rate within some of the default reports.
For example:
- Navigate to “Demographic Details report”. If you have linked Google Search Console, you can find the engagement rate metric in the “Google Organic Search Traffic” report.
- Interestingly, it is not included in the default ‘Pages and Screens’ report or the ‘Engagement Overview’ report. However, you can customize these reports and add the engagement rate metric if you have edit or admin-level permission.
Below is a Comparison table between bounce rate in Universal Analytics (UA) and engagement rate in Google Analytics 4:
| Metric | Bounce Rate (UA) | Engagement Rate (GA4) |
|---|---|---|
| Definition | Percentage of sessions with a single engagement event (e.g., single-page sessions) | Percentage of sessions with multiple engagement events |
| Calculation | (Single-engagement sessions / Total sessions) * 100% | (Engaged sessions / Total sessions) * 100% |
| Focus | Measures lack of user interaction or single-page visits | Measures user interaction and multiple engagement events |
| Duration | Doesn’t consider session duration | Considers session duration as a factor of engagement |
| Events | Considers a limited set of predefined events (e.g., page views, scrolls) | Can include a wide range of custom-defined events and interactions |
| Interpretation | Higher bounce rate indicates lower engagement or unsatisfactory user experience | Higher engagement rate suggests active user involvement and interaction |
| Enhanced Insight | Limited view of user behavior and engagement | Provides a more comprehensive understanding of user interactions and involvement |
| Migration | UA data and reports don’t directly translate to GA4’s engagement rate | Bounce rate data can be analyzed alongside engagement rate to compare metrics |
A few more alternatives can be used:
VIEWS PER USER: The ‘Views Per User’ metric helps understand how frequently people interact with each page on your website on average. Let’s take an example: If a person visits your home page, then goes to your contact page, and later returns to the home page, the home page would have received two views. On the other hand, if another person visits your home page and leaves without viewing any other page, it would count as one view for the home page. In this scenario, we would have three views of the home page (two from the first person and one from the second) and two users. To calculate the ‘Views Per User’ for the home page, we divide the total number of views (three) by the number of users (two).
3 views / 2 users = 1.5 views per user
AVERAGE ENGAGEMENT TIME: It provides insight into the average duration people spend on each page. It is a useful metric, especially when you anticipate visitors will find all the necessary information on a single landing page.
UNIQUE USER SCROLLS: It indicates the number of individuals who have scrolled through at least 90% of a page. It provides an understanding of the engagement level and shows how many users have interacted with the content by scrolling down the page.
How to add bounce rate to standard reports in Google Analytics 4?
Assessing your bounce rate in GA4 can be a bit challenging:
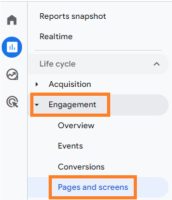
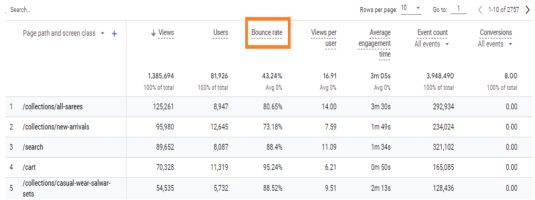
- First, go to the Reports on the left tab. Then, click > Engagement > Pages and screens.
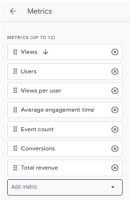
- To personalize the report, click on the edit icon at your screen’s upper right corner. This will bring up a sidebar on the right side of the icon. Select >Metrics. It will show the default metrics included in the Pages and screens report. Click Add metric at the very bottom.
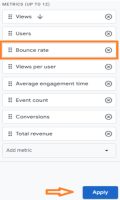
- Select “Bounce rate.” Click and drag the “Bounce rate” label to move it up so that it’s one of the first columns (refer the image below). Then, click “Apply.”
- The bounce rate is now reflected in the report. So, click > Save > Save changes to current report > Save.
- You can now verify that you have effectively personalized the standard report by adding the bounce rate.
Conclusion:
GA4’s revised approach to measuring bounce rate, as part of GA4 implementation, brings a more nuanced and insightful perspective on user engagement. By shifting the focus from single-page sessions to engaged sessions, GA4 better understands how visitors interact with a website or app. In addition, the introduction of metrics such as Engagement Rate and Engagement Time provides a more comprehensive analysis of user behavior, enabling businesses, with the assistance of a GA4 Agency, to optimize their digital experiences and drive meaningful engagement with their audience.

How you acquire users? Differences Between User Acquisition and Traffic Acquisition in GA4
In the bustling world of digital analytics, understanding how users discover and interact with your online domain is pivotal. Two critical reports in Google Analytics 4 (GA4), User Acquisition and Traffic Acquisition, play distinct roles in this journey. In this exploration, we will delve into the nuances, highlight the differences, amplify the challenges, and offer a simple solution to decipher the mysteries of User Acquisition vs. Traffic Acquisition.
DIFFERENT ATTRIBUTION:
At the heart of the User Acquisition vs. Traffic Acquisition debate lies the difference in attribution models.
USER ACQUISITION: EMBRACING THE FIRST-CLICK ATTRIBUTION MODEL
User Acquisition, as the name suggests, focuses on how users are acquired. It employs the first-click attribution model. In simpler terms, it gives credit to a user’s first interaction with your website or app.
TRAFFIC ACQUISITION: NAVIGATING THE LABYRINTH OF LAST-CLICK ATTRIBUTION
On the other hand, Traffic Acquisition tracks the most recent source of traffic that brought a visitor to your website. This report relies on the last-click attribution model. It attributes the conversion or interaction to the last touchpoint before the user arrives at your digital doorstep.
USER ACQUISITION VS. TRAFFIC ACQUISITION:
Understanding the specifics of each acquisition type is essential for navigating the digital landscape effectively.
USER ACQUISITION: THE PRELUDE TO ENGAGEMENT
What it tells us:
- First Interaction: Reveals where users first discovered your website.
- First-Click Attribution: Credits the channels or sources that initiate user engagement.
Example: Imagine a user stumbles upon your site through an organic search result. Using the first-click attribution model, User Acquisition would credit this search as the initial touchpoint that led the user to your digital space.
TRAFFIC ACQUISITION: TRACING THE FINAL STEPS
What it tells us:
- Last Interaction: Focuses on the most recent touchpoint before the user arrives.
- Last-Click Attribution: Attributes the conversion or interaction to the last channel or source.
Example: Now, consider the user from the previous example. After discovering your site through organic search, they later click on a social media ad leading to a conversion. Traffic Acquisition, using the last-click attribution model, would credit the social media ad as the final step in the user’s journey.
THE ATTRIBUTION PUZZLE: NAVIGATING CHALLENGES IN UNDERSTANDING USER ENGAGEMENT MODELS
As straightforward as these reports sound, the disparity in attribution models often amplifies the challenges for marketers and website owners.
User Acquisition Dilemma: The problem lies in understanding that User Acquisition credits the first interaction, which might only sometimes align with the last touchpoint that led to a conversion. This can lead to misconceptions about the effectiveness of specific channels or sources.
Traffic Acquisition Challenge: Conversely, relying solely on Traffic Acquisition might overlook the initial touchpoints that play a crucial role in engaging users. The report might not provide a holistic view of the user journey by focusing on the last-click attribution model.
SOLVING THE PUZZLE: BRINGING CLARITY TO USER ENGAGEMENT WITH A HOLISTIC STRATEGY
The key to overcoming these challenges is adopting a holistic approach that blends User and Traffic Acquisition insights.
A HOLISTIC USER JOURNEY:
- Combine User and Traffic Acquisition Reports:
- Understand that both reports are crucial for a comprehensive view.
- Utilize User Acquisition to see how users initially find your platform.
- Complement this with Traffic Acquisition to understand the final steps before conversion.
- Embrace Attribution Flexibility:
- Recognize that attribution models serve different purposes.
- Blend insights from first-click and last-click attribution to form a complete understanding of user journeys.
REAL-WORLD EXAMPLE:
Consider a user who discovers your website through an email campaign (User Acquisition) and later converts after clicking on a paid search ad (Traffic Acquisition). By combining insights from both reports, you see the complete user journey, understanding the role of each touchpoint in the conversion process.
IN CONCLUSION, MASTERING THE DIGITAL SYMPHONY
As you navigate the GA4 terrain, remember that User Acquisition and Traffic Acquisition reports are not adversaries but symphony members playing different tunes. By harmonizing insights from both, you can orchestrate a complete understanding of user engagement. Unraveling the User Acquisition vs. Traffic Acquisition problem is about more than choosing one over the other but realizing their unique contributions to the digital symphony.
So, embrace the diversity of attribution models, leverage insights from both reports and master the digital landscape with a nuanced understanding of how users embark on their journey through your online realm.